Know whether your NIR calibration will hold before you trust it
Import spectra, compare preprocessing, fit PLS and read the numbers that matter: error on new samples, RPD, bias and outlier flags. Built by the team behind the SpectroScience NIR course.
- 600 fruit scanned
- 100 unseen season
- 1.00 % error
600 whole mango fruit, one number to predict: dry matter
600 fruit from three seasons, each weighed against a laboratory dry-matter value (10.9 to 22.9 %).
The laboratory number is the truth the model learns from. The instrument never sees it.
Collect reference values for as many samples as you can before you scan.
Illustration, not data. Source: Spectra Lab engine run, 9 Oct 2026, mango teaching subset (CC BY 4.0).
Every fruit gives a curve, and the curves look alike
Each fruit scanned from 684 to 990 nm, 103 points. Twelve shown, coloured from low to high dry matter.
The curves stack by height and tilt. The differences that matter are small bends.
Look at your own spectra before you model them.
Next step: follow one sample through all six stations.
Correct the curves and the shape that tracks dry matter is left
Raw spectra against a 1st derivative, a 2nd derivative and SNV.
Offsets and slopes disappear. On the season the model never saw the 1st derivative gave the lowest error, 1.00.
Drag the slider, then compare on your own data when the Lab opens.
Raw spectra: the curves differ mostly by height and slope.
Source: Spectra Lab engine run, 9 Oct 2026, mango teaching subset (CC BY 4.0). Twelve of the 600 calibration fruit, coloured from low to high dry matter.
The error stops falling at about 10 components
PLS with 1 to 15 components, scored by cross-validation and on the unseen season.
Both errors are flat from about nine components, so more components add nothing.
Stop where the curve goes flat.
10 components with 1st derivative.
Source: Spectra Lab engine run, 9 Oct 2026, mango teaching subset (CC BY 4.0).
On a season it never saw, the typical error is 1.00 % dry matter
100 fruit from a fourth season, kept out of the model.
Most points sit on the dashed line. High values run low, a bias of -0.19.
Always report the number from data the model never saw.
1st derivative: typical error 1.00 % dry matter, bias -0.19, error after removing bias 0.99, RPD 2.94, which the Lab bands as rough quantitative.
Source: Spectra Lab engine run, 9 Oct 2026, mango teaching subset (CC BY 4.0). 100 fruit from a season the model never saw. RPD here is the spread of the reference values divided by the error after removing bias.
Next step: check your own predictions in the free calculators.
Rough quantitative: RPD 2.94. Is that enough for you?
The Lab's bands: below 1 no predictive value, 1 to 2 screening only, 2 to 3 rough quantitative, 3 or more quantitative.
This model is 2.94, just under the quantitative line.
Type the error you can accept and read the verdict.
Your limit is 1.00; 1st derivative gives a typical error of 1.00 on a season it never saw, and an RPD of 2.94 (rough quantitative).
Source: Spectra Lab engine run, 9 Oct 2026, mango teaching subset (CC BY 4.0). Your limit is your own requirement; the Lab does not set it.
Next step: see why calibrations miss.
Three questions you can follow off the main route
- Follow it →
From scan to verdict
One sample, six dated entries, from the cuvette to a verdict.
- Follow it →
Why did my calibration fail?
Symptom, cause and fix, with plots from a real run.
- Follow it →
Move a model to a second instrument
Bias and slope before and after a correction. The second instrument is simulated and labelled.
Paste your own reference and predicted values and get the same statistics
Your own pairs of laboratory value and model prediction, pasted here.
The page computes bias, SEP, RMSEP, slope, R² and RPD in your browser and sends nothing anywhere.
Run it on your current model today. It is free and needs no sign-up.
Next step: all the free calculators, including laboratory error from blind duplicates.
This is the Lab that ran these numbers
Screens from the Lab as it runs today for SpectroScience instructors. The data in them is real; students are next.
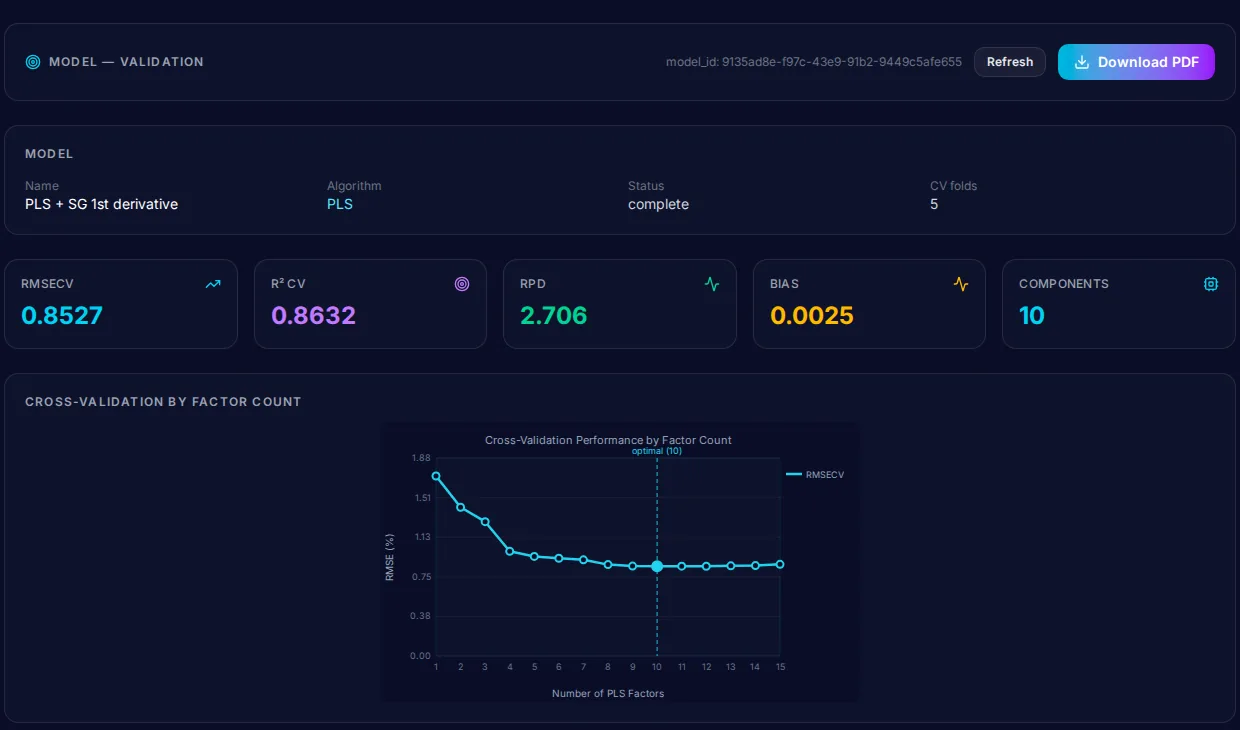
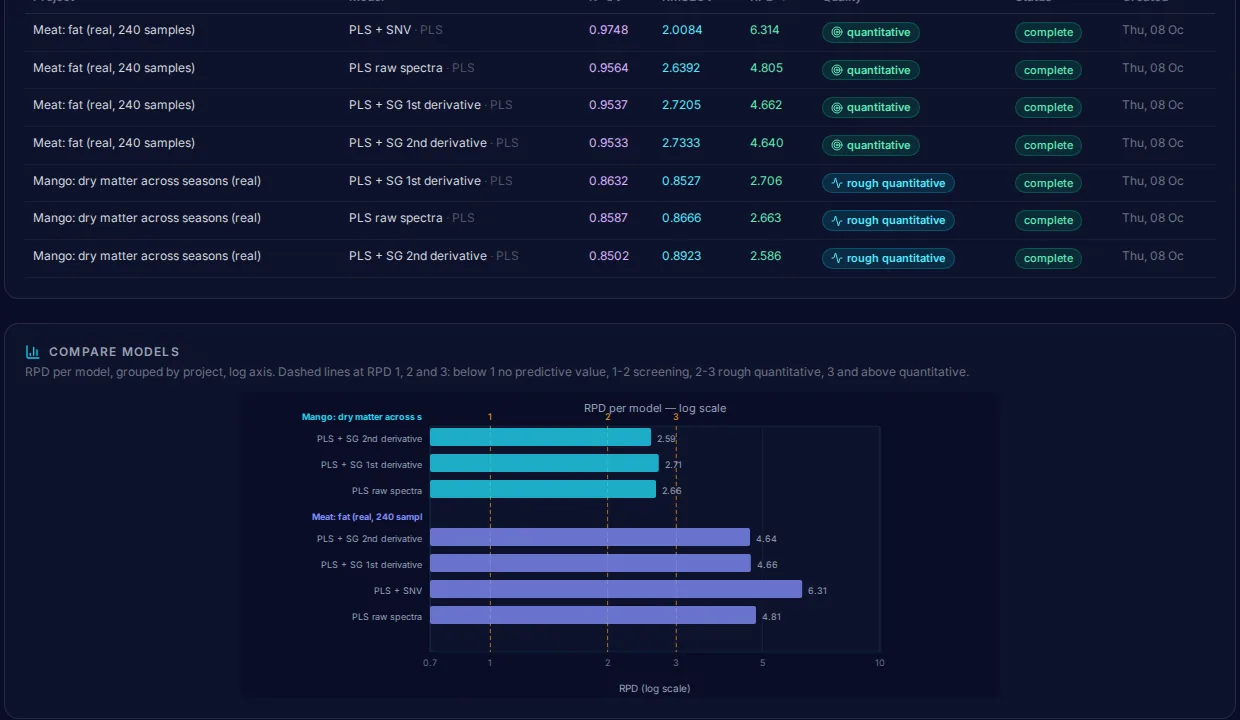
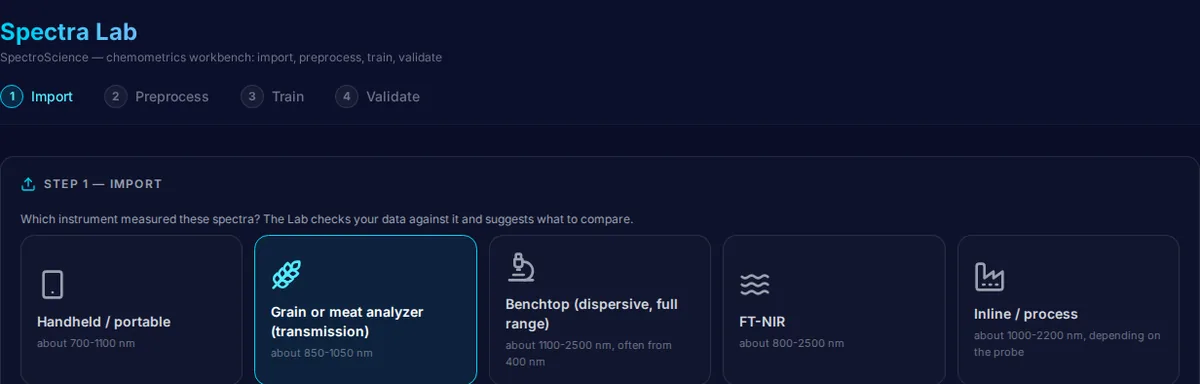
Next step: join the waitlist or learn the method in the SpectroScience NIR course (32 lessons, $99, lifetime access).
Be first when the Lab opens
SpectroScience course students hear first; then everyone on the list. We write once, when it opens, and we do not promise a date.
Get the sample validation report as a PDF
Every section of the Demo above, as a printable PDF, sent to an address you can open. Add what you measure if you want a place in the pilot for a run on it.
We check that the address can receive mail before anything is sent; temporary inboxes are refused. One email, no account. The engines are not self-serve yet, so a run on your own subject is a pilot place, not an instant report.